
4 easy-to-follow steps to analyze a Q&A session to find market signals
My Prompt and Google Sheet AI formula to analyze Bank of America's Q1 earnings call

Why should I care?
Your firm should be looking at market signals.
You shouldn't just rely on the news or social content.
You can save your firm from spending tens of thousands of dollars on marketing intelligence reports if you follow this exercise to track signals in the market.
You can impress others at your company or online
This exercise should take about the same amount of time to read this post: 3 minutes
An easy way to look for signals is by using LLM's for sentiment analysis (assessing a positive or negative tone or view)
🔑 Once you learn the right prompt architecture and steps you can run a sentiment analysis of:
a recent sales call
an employee town-hall meeting
an investor or diligence meeting
🏦 I ran this one on Bank Of America's Q1 Earnings call right after they finished the call.
👉The source - captions from Bank of America’s earnings call
👉 The Tool
Gemini for its 1 Million token prompt input & its Canvas function
👉 The Prompt architecture
Goal
Context
Instructions
sub-set of instructions
Table Schema format:
Column 1 | Column 2| Column 3| etc.
note - keep this step step simple or it will overwhelm gemini. Get the data into sheets and analyze again.
👉 The Prompt:
My goal is to evaluate the Q&A from the transcript below.


Context: The Q&A transcript is from Bank Of America's earnings call this morning.


Instructions:

- Convert the transcript into a table format consisting of the following columns:

Question # | Question | Questioner | Responder 1 | Response 1 | Responder 2 | Response 2 | Responder 3 | Response 3


- Provide a summary consisting of:

- Total number of Questions broken down by questioner

- Categorize the questions into topics such a "BoA focused" and "Market Focused"

- Write an Executive Summary that focuses on sentiment analysis of the Q&A in regards to view of the market based on questions asked and the responders responses👉 The output ELT (extract, load, transform):
a. Copy the table from the canvas by clicking the copy icon
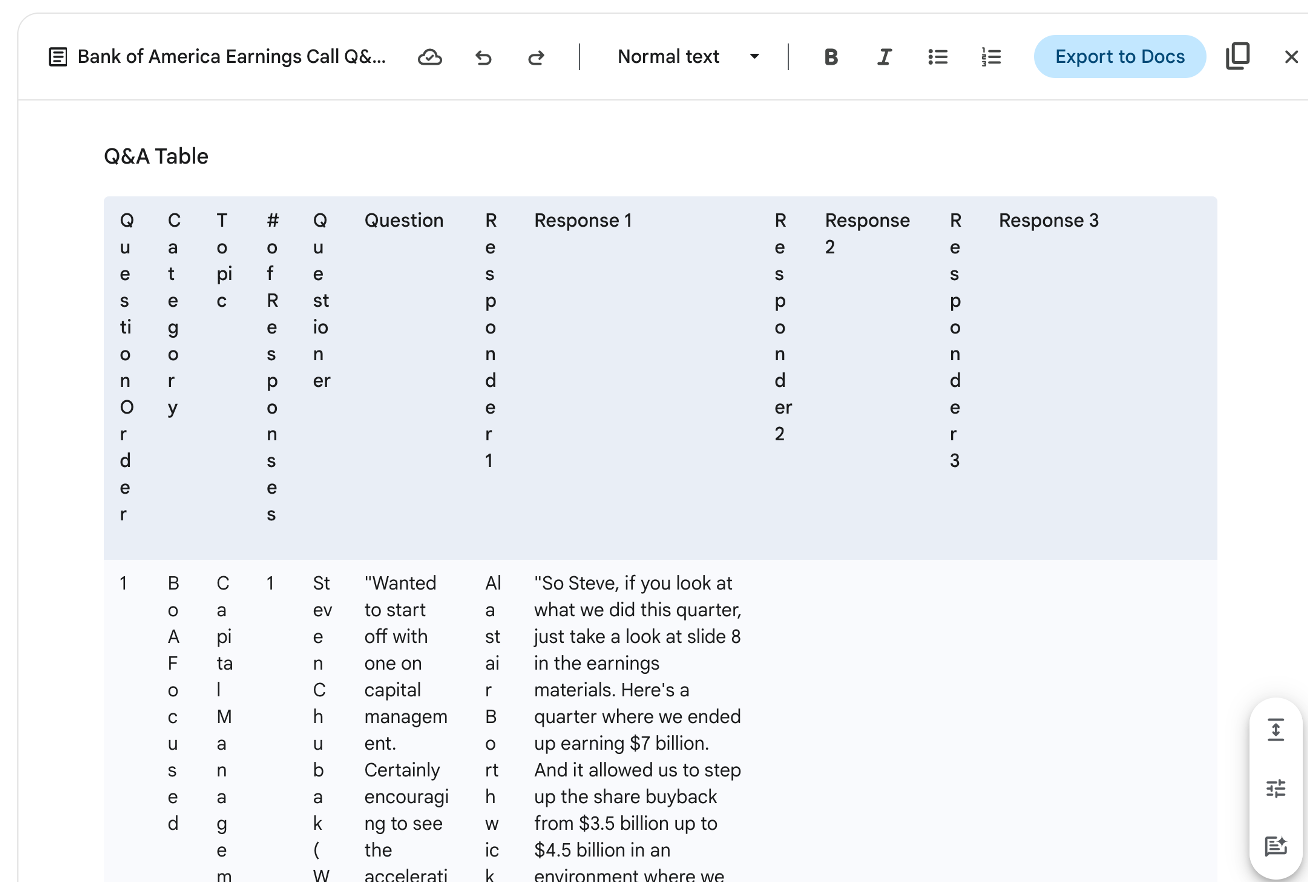
b. Paste into Google Sheets
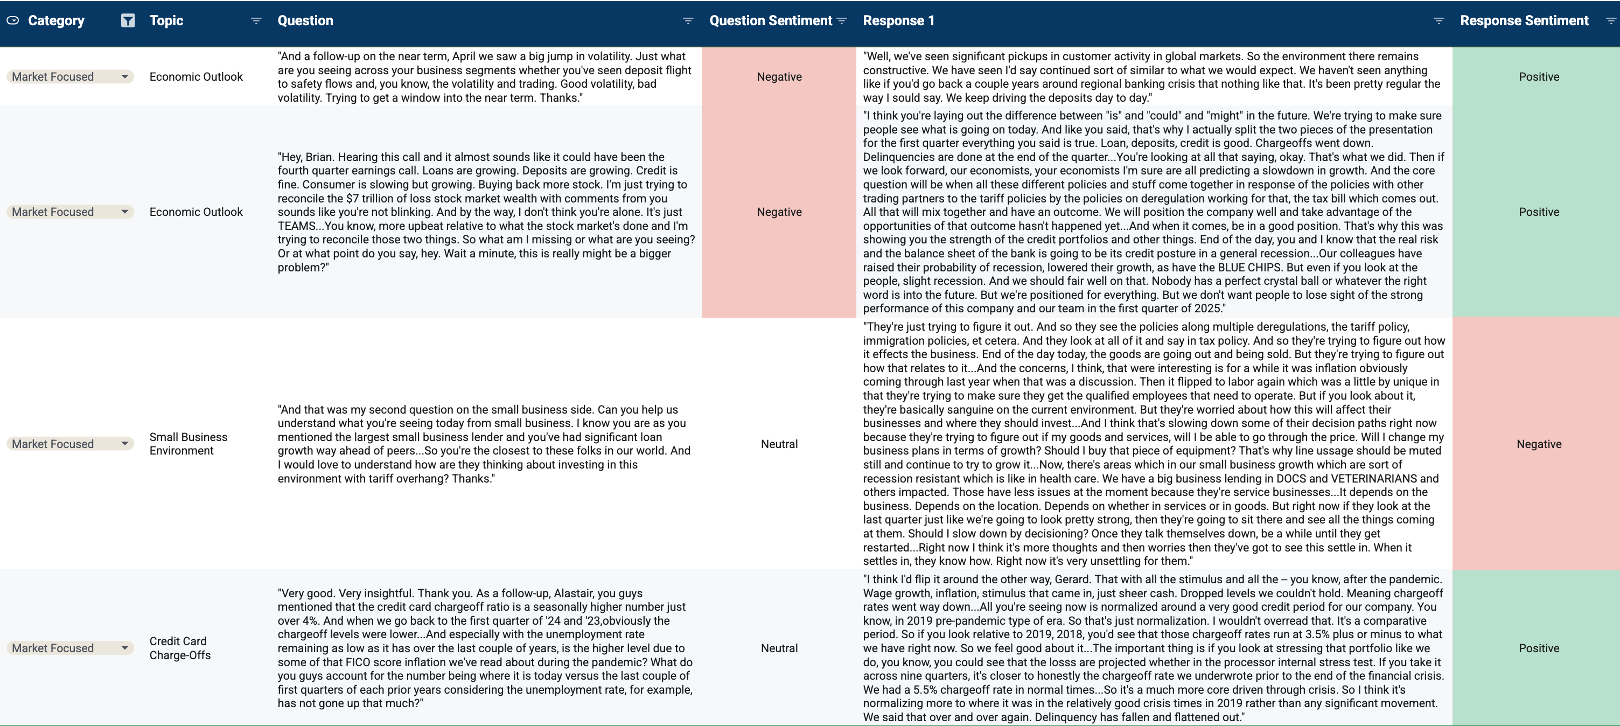
c. add sentiment columns & apply =ai("instructions",range) formula
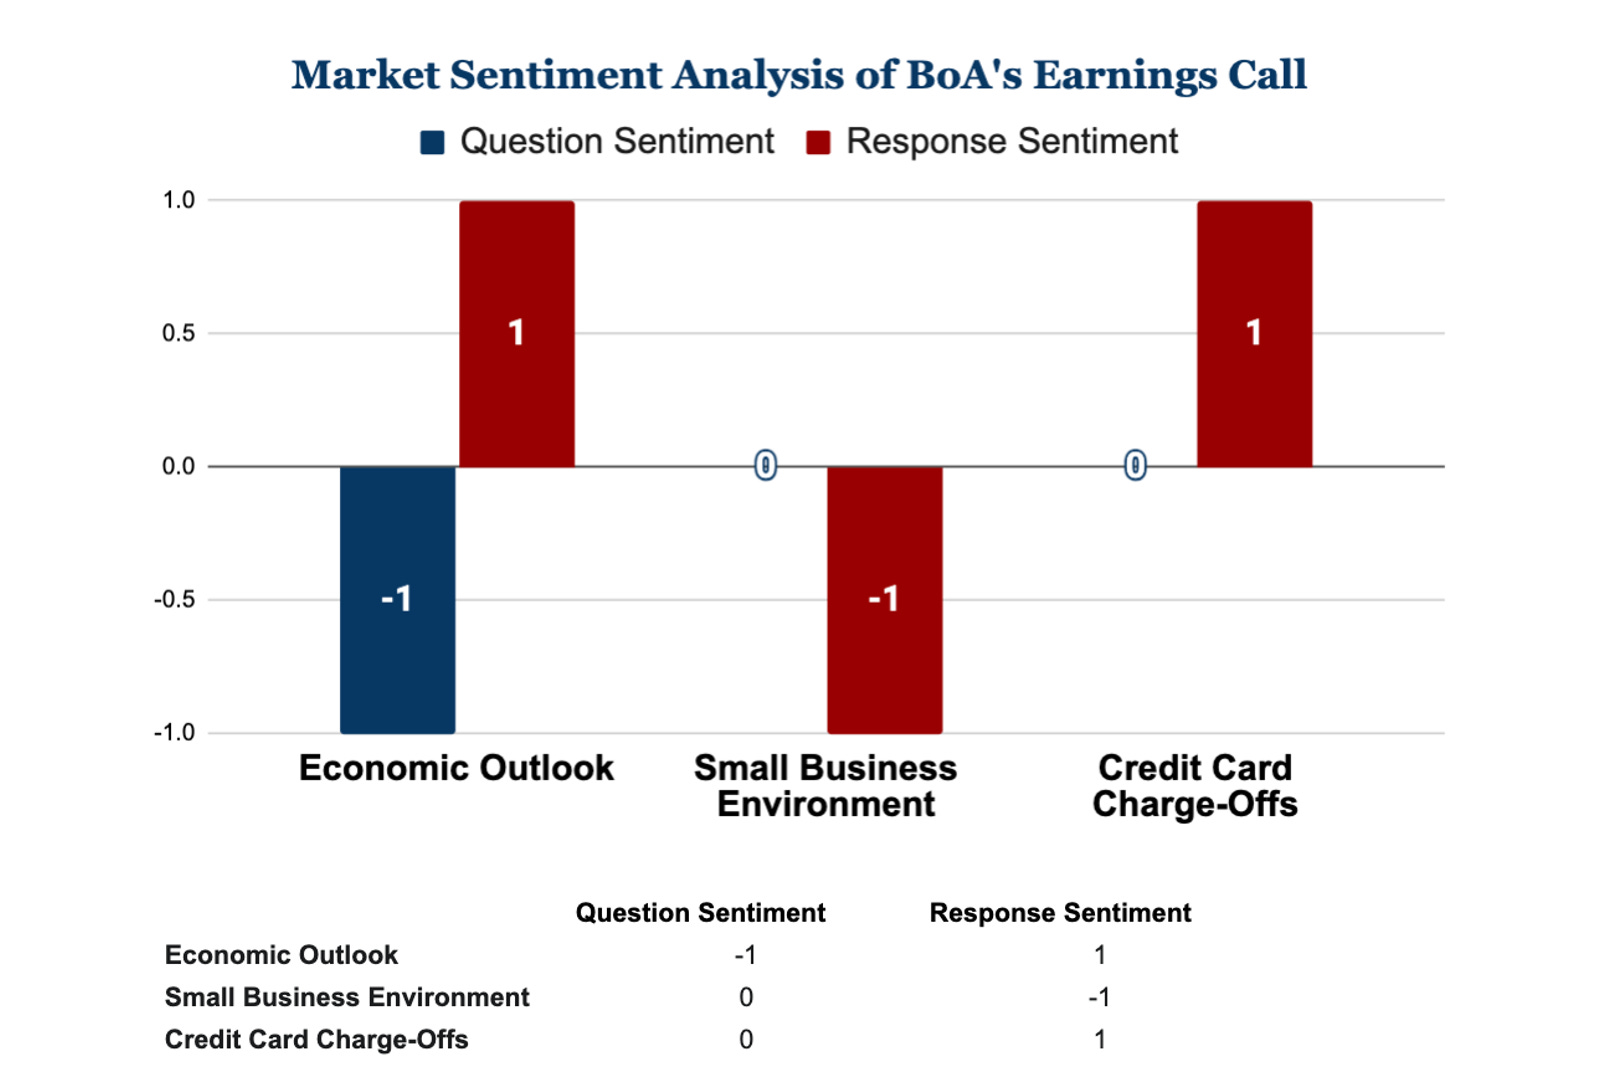
=AI(”Classify the text as positive or Negative”,<cell>)👉 The visual: a column chart in Google sheets
a. Select the table & Insert a Pivot Table
b. Pivot the data to create the columns (series) you want to display
b. Select the Pivot & insert a chart
c. Display the columns of the pivot as a series of columns in a column chart
📈 Take-aways from the Earnings Q&A
1. BoA is positive on the the overall economy
2. BoA is negative on small-business economy
3. Consumer credit card charge-offs (losses for BoA) are decreasing to their pre-Covid norms
4. Analysts questions started off with a negative sentiment, but with positive responses from BoA their questions shifted neutral
Commercial Signals from Bank of America’s Q1-2025 Earnings call:
SMB will be, and is, spending less
said differently, SMB is “going to cash”
Consumers are managing credit card risks better
said another way, consumers are not as confident that they will be able to pay-off credit card balances
But good intelligence tradecraft requires
Signal validation from a secondary source
Multiple validated signals ( data points ) to draw a line/paint the picture,
in this case: SMB spend will be down
how much?
on what products and services?
A good Market Intelligence engineer will:
identify sources of signal
capture the signals
consolidate themes
develop the picture being painted in order to navigate uncertainty
Comment below if you were able to complete the exercise and let me know your thoughts
Thank you for reading,
-Will